Grids

| Main page |
|
Index |
| Bug list |
| Documentation |
| Doc errors |
| Examples |
| 2D Gallery |
| 3D Gallery |
|
Packages
|
|
References
|
|
CTAN Search CTAN: Germany USA |
|
Statistics |
|
Extended translation of the the 5th edition |
|

the 7th edition, total of 960 colored pages |
|
2nd edition, 212 pages, includes 32 color pages |
|
 |
|
 |
|
 |
|
 |
|
 |
|
|
|
|
|
 |
|
 |
| Font | Special gridstyle |
|---|---|
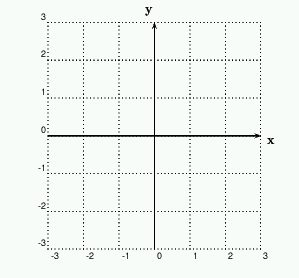
By default the labels are set in the default font, which is not easy to change, when you
choose for example package mathptmx. With the following definition of \myGrid
it is possible to have also the labels in times.
\documentclass[12pt]{article}
\usepackage{pstricks}
\usepackage{pst-plot}
\usepackage{mathptmx}

\def\myGrid(#1,#2)(#3,#4){%
  \def\pshlabel##1{\footnotesize $##1$}%
  \def\psvlabel##1{\footnotesize $##1$}%
  \psgrid[gridlabels=0pt,subgriddiv=1,griddots=10]
  \psaxes[Ox=#1,Oy=#2,linestyle=none](#1,#2)(#3,#4)
}
\begin{document}

\begin{pspicture}(-4,-4)(4,4)
  \myGrid(-4,-4)(4,4)
   This is some text in times
\end{pspicture}

\end{document}
|


|
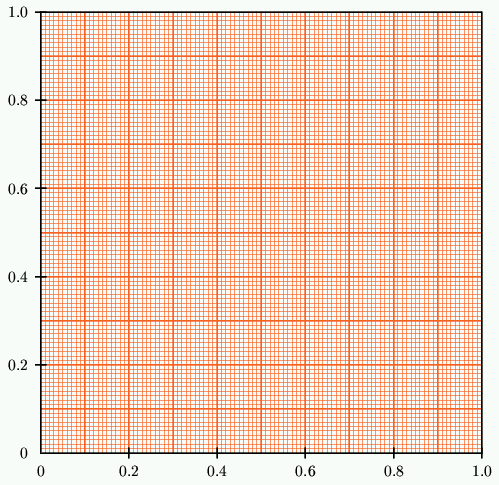 |
\documentclass{article}
\usepackage{pstricks}
\usepackage{pst-plot}
\definecolor{orange}{cmyk}{0,0.61,0.87,0}
\pagestyle{empty}
\begin{document}
\begin{pspicture}(10,10)
  \psgrid[subgriddiv=10,%
  	gridlabels=0,%
  	gridwidth=1pt,%
  	gridcolor=orange,
    subgridwidth=0.1pt,%
    subgridcolor=orange](10,10)
  \psset{unit=10}%
  \psaxes[axesstyle=frame,Dx=.2,Dy=.2,
          linewidth=0.5pt,linewidth=1pt](0,0)(1,1)
\end{pspicture}
\end{document}
|
| Special overlays | |
|---|---|
 |
 |
|
|
|