General information
Submit an item
Download style files
Copyright
Contact us


|
Journal home page
General information Submit an item Download style files Copyright Contact us |
|
|
|
|
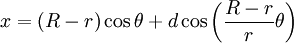
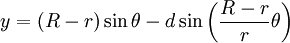
Spirograph with PSTricksOnce upon a time, 1965 to be precise, a children's toy called the Spirograph was invented by the British engineer Denys Fisher. It consisted of a set of gears of varying size. One gear was pinned to a sheet of paper, and one or two other gears were rotated along the fixed gear using a pen or pencil. This way a fascinating trail was left on the paper. A trail known to mathematicians as a Hypotrochoid when the fixed gear is circumambulated on the inside, or a Epitrochoid when the fixed gear is circumambulated on the outside. Spirographs have remained popular ever since. The mechanical version is still for sale in many toy stores. It is, however, also possible to create these lovely figures with PSTricks! The parametric equations for a hypotrochoid are:
And these can be entered into a simple PSTricks document, choosing — for example — R=100, r=2 and d=80:
\documentclass{article}
\usepackage{pstricks}
\usepackage{pstricks-add}
\usepackage{pst-plot}
\begin{document}
\thispagestyle{empty}
\psset{xunit=0.01in,yunit=0.01in,algebraic}
\begin{pspicture}[showgrid=false](-100,-100)(100,100)
  \parametricplot[plotstyle=curve,linewidth=0.1pt,plotpoints=1000]{0}{360}%
    {(100-2)*cos(t)+80*cos((100-2)/2*t)|(100-2)*sin(t)-80*sin((100-2)/2*t)}
\end{pspicture}
\end{document}
Note that I have had to fill in the numbers in the equations by hand. Also I
have had to adjust the coordinates in the \begin{pspicture} command.
I chose 100, because that is slightly more than R-r. Finally, I have had to
adjust xunit and yunit so that the total picture ends up
fitting on the page. In this case it'll be two by two inches.
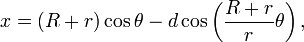
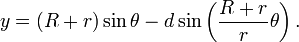
The result looks like this: Similarly, it is easy to convert the epitrochoid equations
into PSTricks code, choosing the same values as before, R=100, r=2, d=80:
\documentclass{amsart}
\usepackage{pstricks}
\usepackage{pstricks-add}
\usepackage{pst-plot}
\begin{document}
\thispagestyle{empty}
\psset{xunit=0.01in,yunit=0.01in,algebraic}
\begin{pspicture}[showgrid=false](-102,-102)(102,102)
  \parametricplot[plotstyle=curve,linewidth=0.1pt,plotpoints=1000]{0}{360}%
    {102*cos(t)-80*cos(51*t)|102*sin(t)-80*sin(51*t)}
\end{pspicture}
\end{document}
And the result of this code looks like this:
Happy Spirographing! |
Page generated June 9, 2010 ;