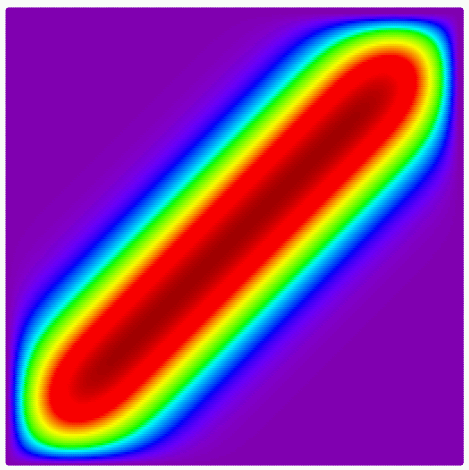
Contour plots

| Main page |
|
Index |
| Bug list |
| Documentation |
| Doc errors |
| Examples |
| 2D Gallery |
| 3D Gallery |
|
Packages
|
|
References
|
|
CTAN Search CTAN: Germany USA |
|
Statistics |
|
Extended translation of the the 5th edition |
|

the 7th edition, total of 960 colored pages |
|

2nd edition, 212 pages, includes 32 color pages |
|
 |
|
 |
|
 |
|
 |
|
 |
|
|
|
|
|
 |
|
 |
 It is only possible to plot data files, which must have the following
structure:
It is only possible to plot data files, which must have the following
structure:
/contourdata [[
x y z
x y z
][
x y z
x y z
...
][
...
] def
it is an PostScript array of array. The Perl script MakeData.pl allows to plot a file of the 3D-data of a mathematical function z=f(x,y) and the Perl script PrepareData.pl prepares the data file into the above structure for using it with the example file.
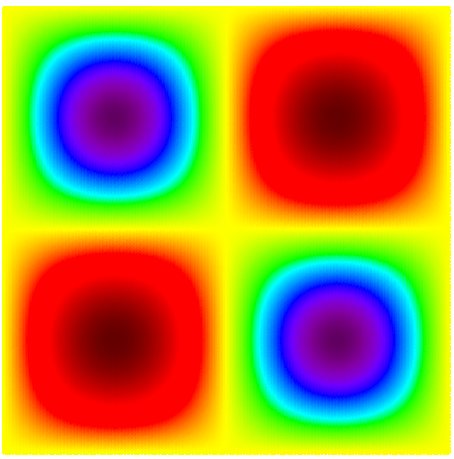
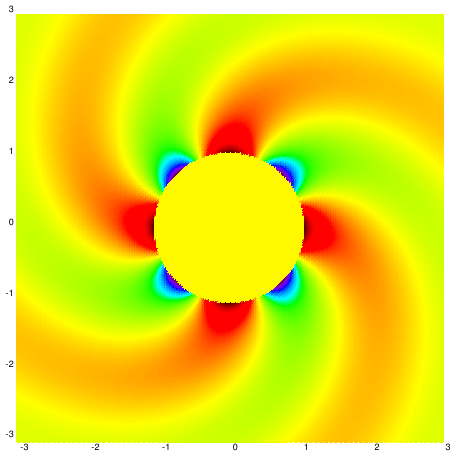
The plain contour data of the function f(x,y)=sin(x)*sin(y).
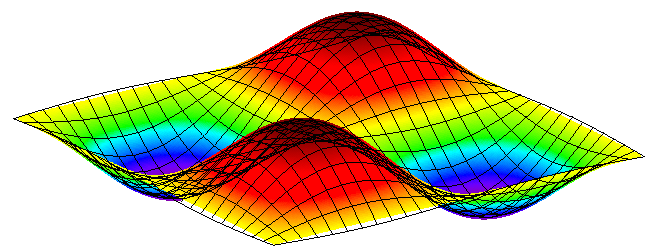
The same as a 3D image.

 (17MByte!)
contourN.data (first example, 2MByte!)
3d.data (second example -- math function, 4MByte!)
(17MByte!)
contourN.data (first example, 2MByte!)
3d.data (second example -- math function, 4MByte!)
 |

|
| you have to unzip the data file before using it! |