Examples

| Main page |
|
Index |
| Bug list |
| Documentation |
| Doc errors |
| Examples |
| 2D Gallery |
| 3D Gallery |
|
Packages
|
|
References
|
|
CTAN Search CTAN: Germany USA |
|
Statistics |
|
Extended translation of the the 5th edition |
|
the 7th edition, total of 960 colored pages |
|
2nd edition, 212 pages, includes 32 color pages |
|
 |
|
 |
|
 |
|
 |
|
 |
|
|
|
|
|
 |
|
 |
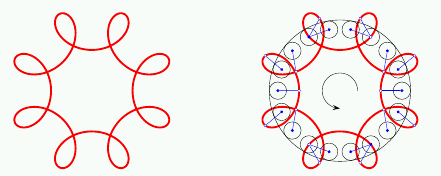
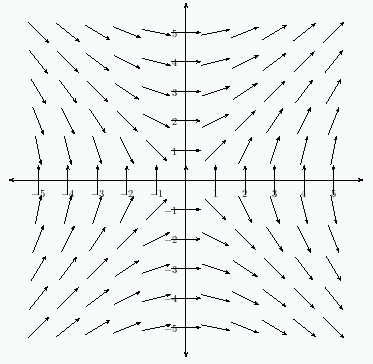
| Cycloid curve |
|---|
 |


|
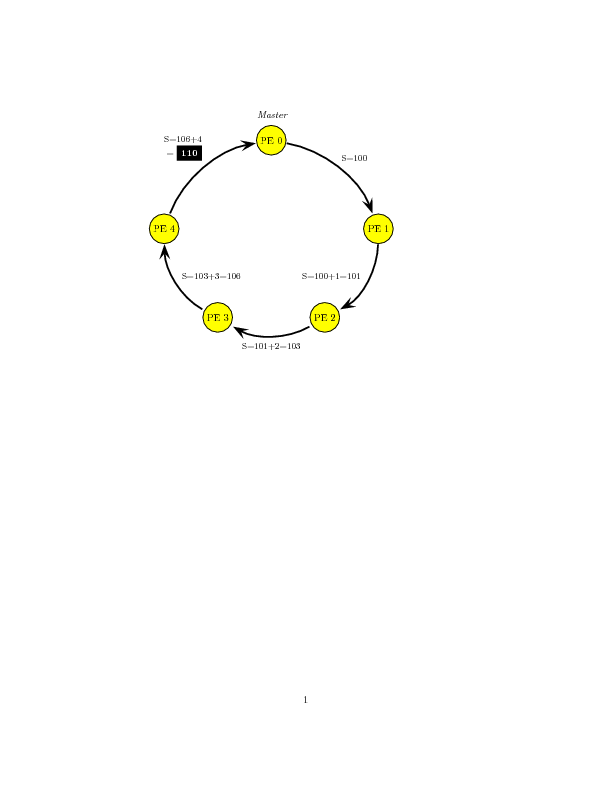
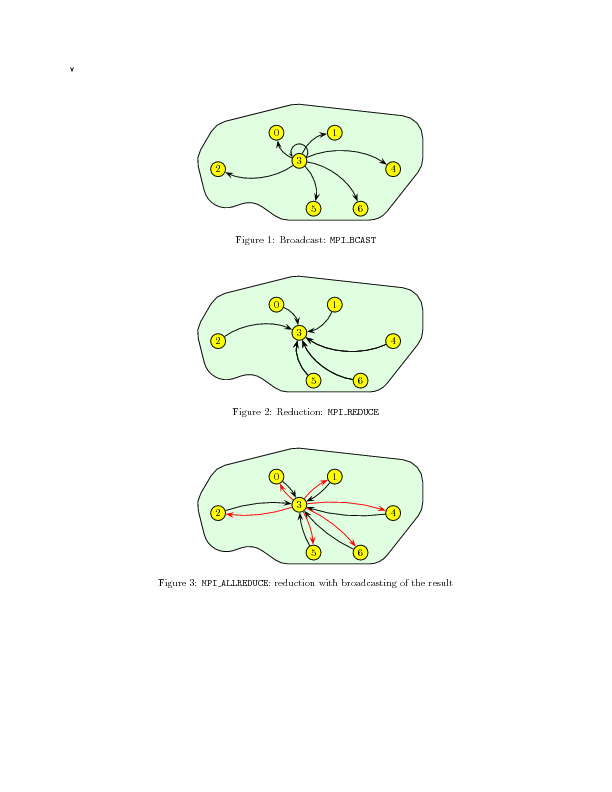
| Associativity | Ring diagram | Communication diagram | \multips |
|||
|---|---|---|---|---|---|---|
 |
 |
 |
 |
|||
|
|
|
|
bow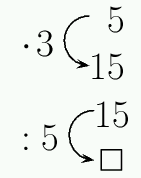
|
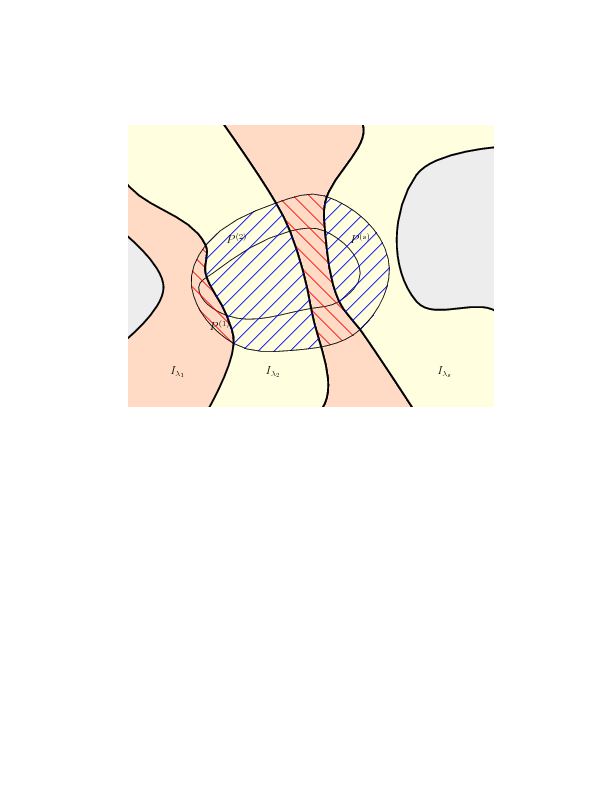
Game theory
|
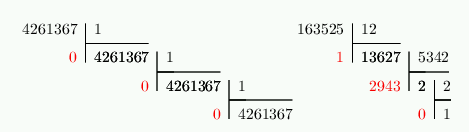
Abacus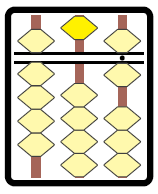
|
||
|
|
|
|
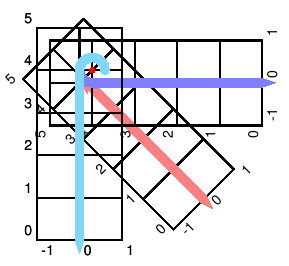
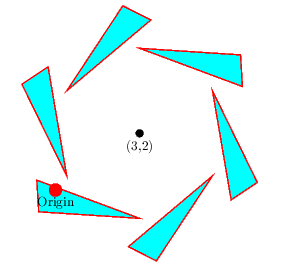
| Rotation of objects | ||
|---|---|---|
 |
 |
 |
|
|
|
|
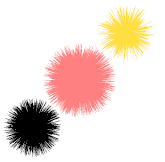
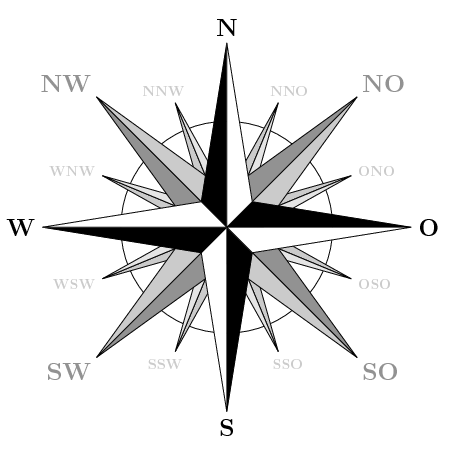
| Ink stain | Compass | |
|---|---|---|
 |
 |
 |
|
|
|
|
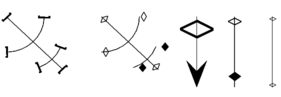
| Special Lines and Dots |
|---|
 |
|
|
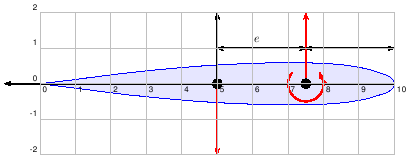
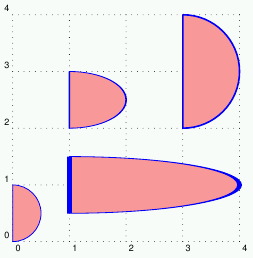
| Drawing Lines | Drawing an airfoil |
|---|---|
 |
 |
|
|
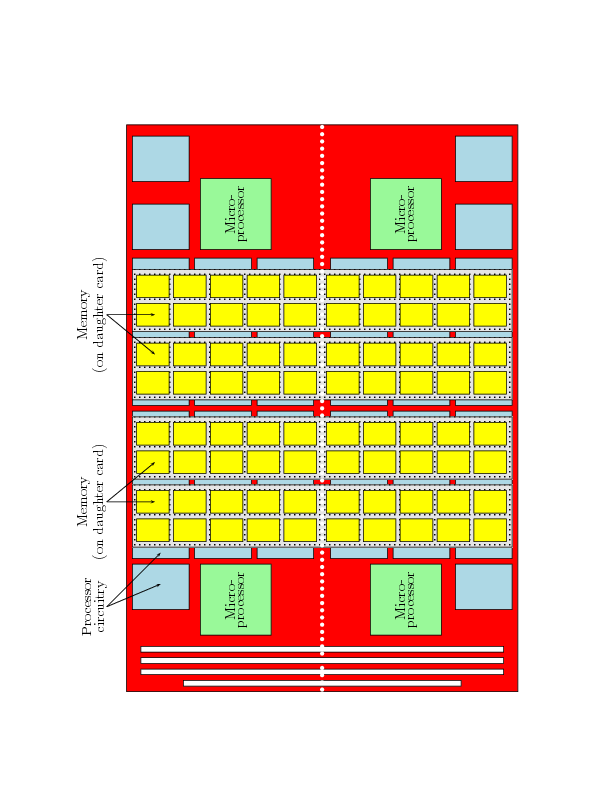
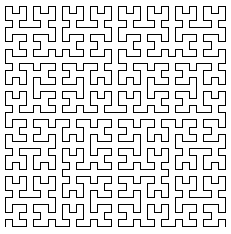
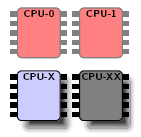
| Hilbert curve | Arcs | CPU symbol |
|---|---|---|
 |
 |
 |
|
|
|
|
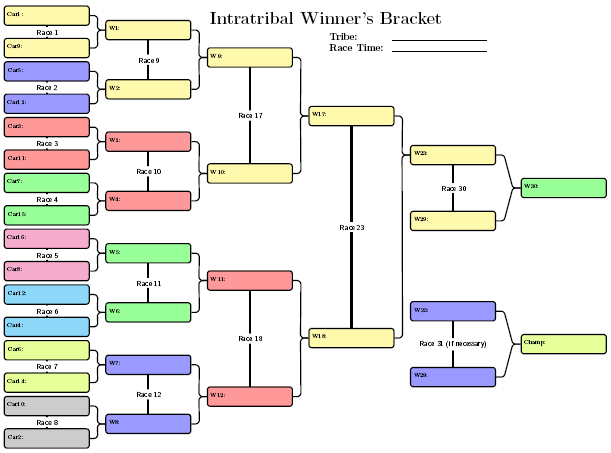
| A Bracket Table |
|---|
 |
|
|
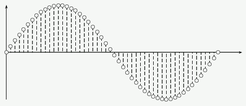
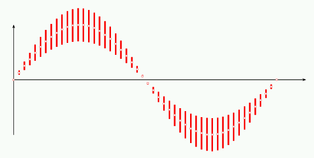
| Dots | ||
|---|---|---|
 |
 |
 |
|
|
|
|
 |
|
 |
with some more examples |
| Cards |
|---|
 |
|
|
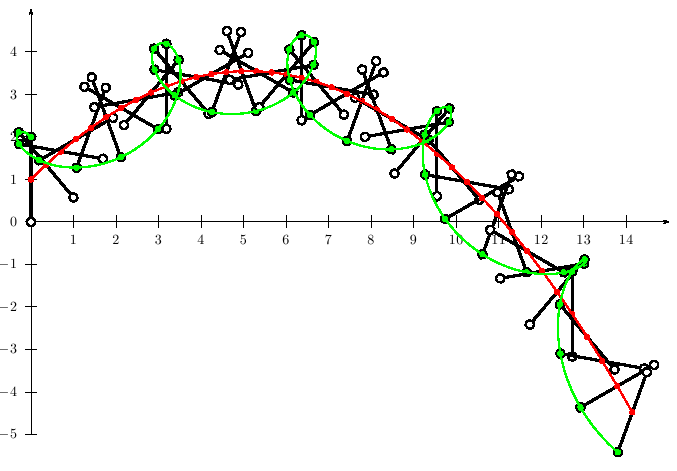
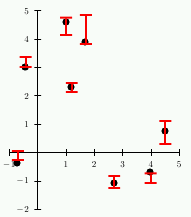
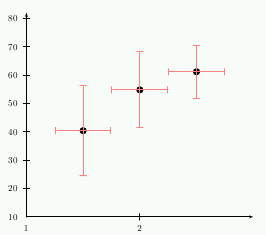
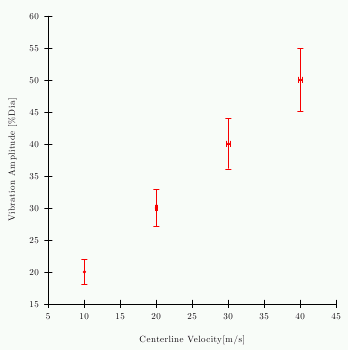
| Error bars | ||
|---|---|---|
 |
 |
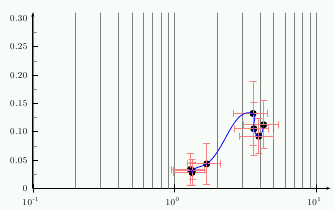 |
The datafile must have entries like
x y dyMin dyMaxThe first two values are the coordinates of the dot and the next two are the relative values of the error, f.ex.: 3 2 -0.2 0.3 | ||
|
|
|
|
 |
||
|
|
||
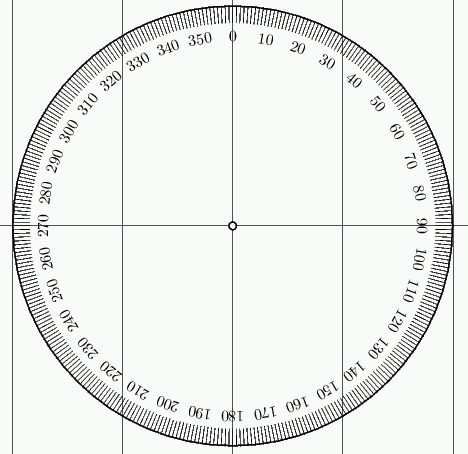
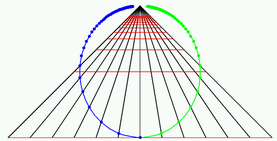
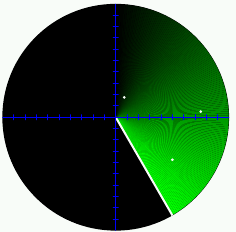
| \psscaleboxto | Radar demo | |
|---|---|---|
 |
 |
|
|
|
|
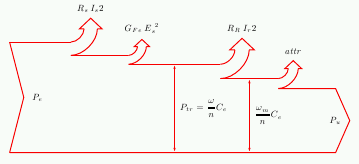
| Power scheme |
|---|
 |
|
|
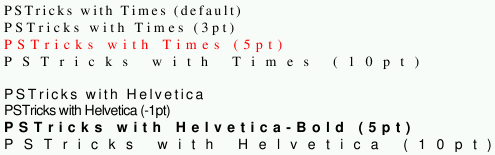
| Letterspacing | |
|---|---|
 |
|
|
|
$Id: examples-list 1595 2020-08-20 08:05:10Z hvoss $